ZOOTRITION Comparison Summary Page
Comparison Summary Page
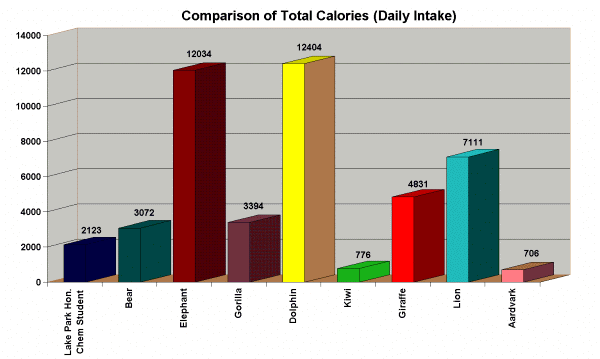
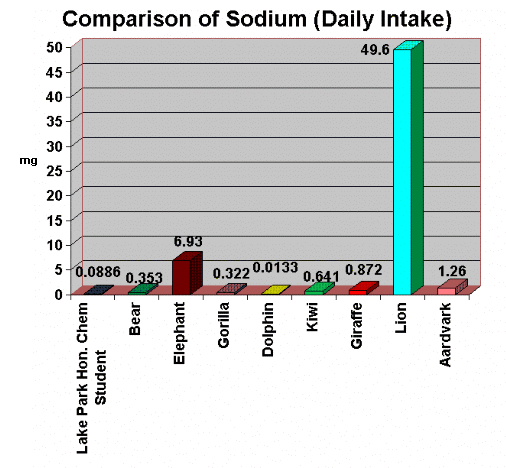
Below are graphs that compare the calorie,
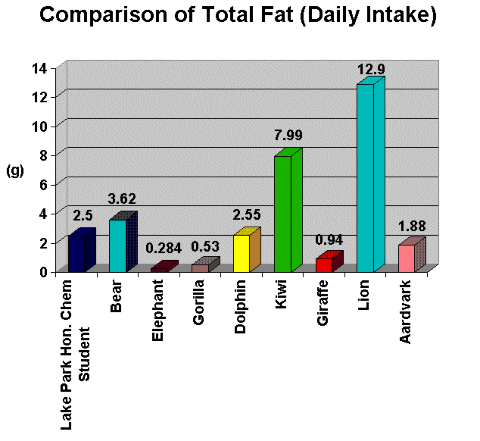
fat,
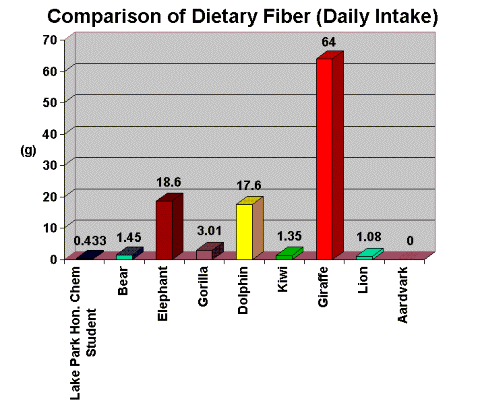
fiber,
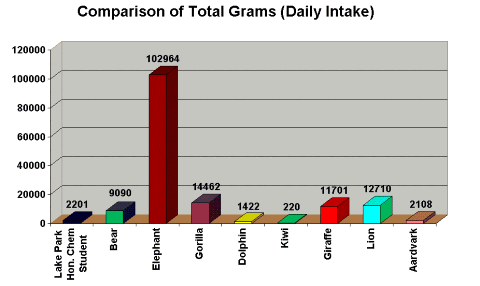
mass,
and sodium intake of the nine animals we studied.
The information included in this page is intended for
informational purposes and may apply only to the circumstances and
situation of a particular animal at the time of the study (October,
1996-March, 1997). General applicability to other animals is unknown.
All nutrition comparisons calculated by Lake Park students
using ESHA Research Food Processor Plus 6.04, and not verified
by the Brookfield Zoo
1
 (Top of
page)
2
 (Top of
page)
3
 (Top of
page)
4
 (Top of
page)
5
 (Top of
page)
Go to the CD-ROM Table of Contents
© 1998 Lake Park High School


